
Visualize Success – Empower Your Business with Data-Driven Insights

Introduction
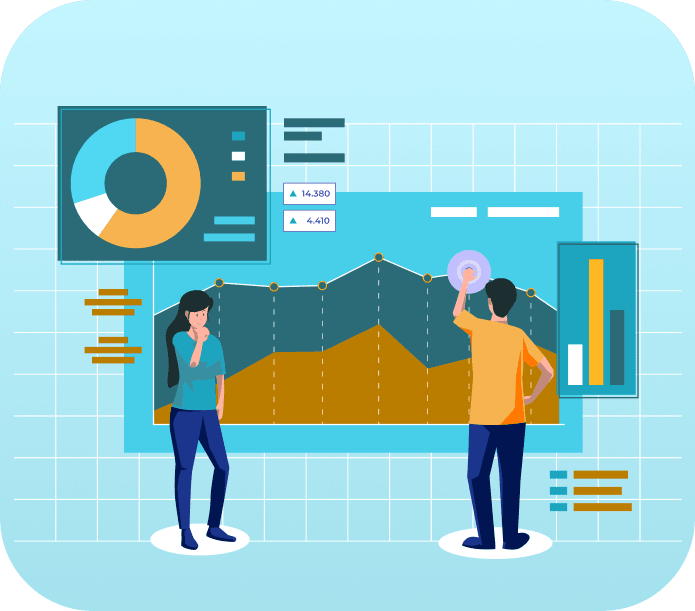
Data is the heart of any business, but raw numbers and unstructured data can be overwhelming and can fail to capture the bigger picture. In this data-driven world, informed decision making is really important by utilizing the vast amount of available data.
We are specialized in transforming complex and unstructured data into clear, understandable and actionable insights through advanced data visualization services to drive smarter business decisions. Our data visualization consulting services leverage the visual elements like charts, graphs, maps and infographics to uncover hidden patterns, trends and relationship between the data to track key performance indicators and present the data in an intuitive form for strategic planning and decision making.
What Can Be Considered for Data Visualization
We Offer a Range of services designed to cater to your specific business needs, whether you are a start-up or an established enterprise. Our services include:

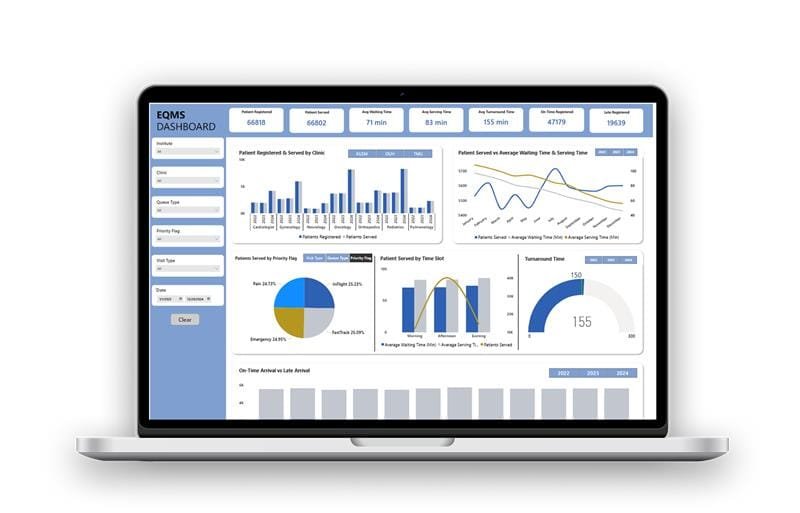
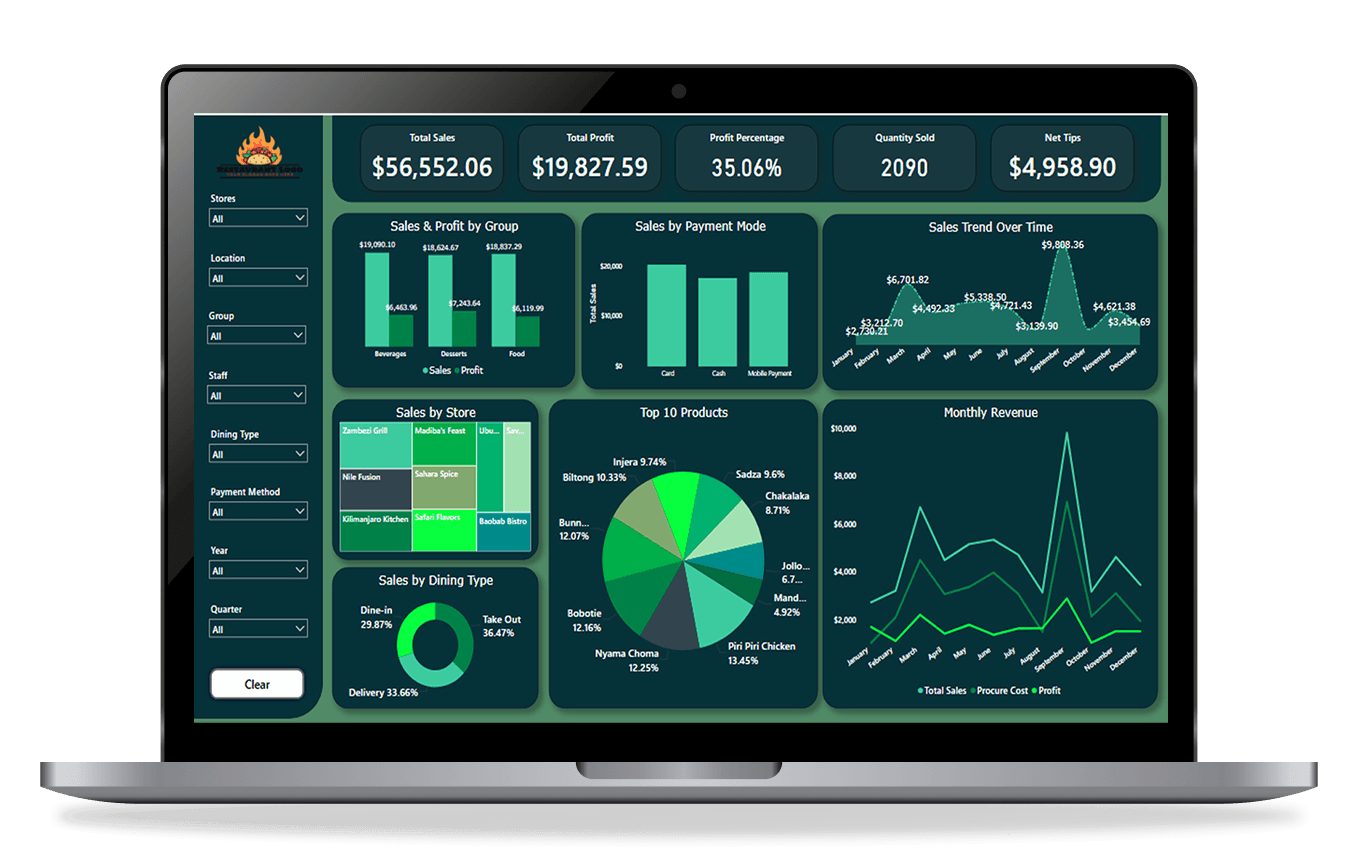
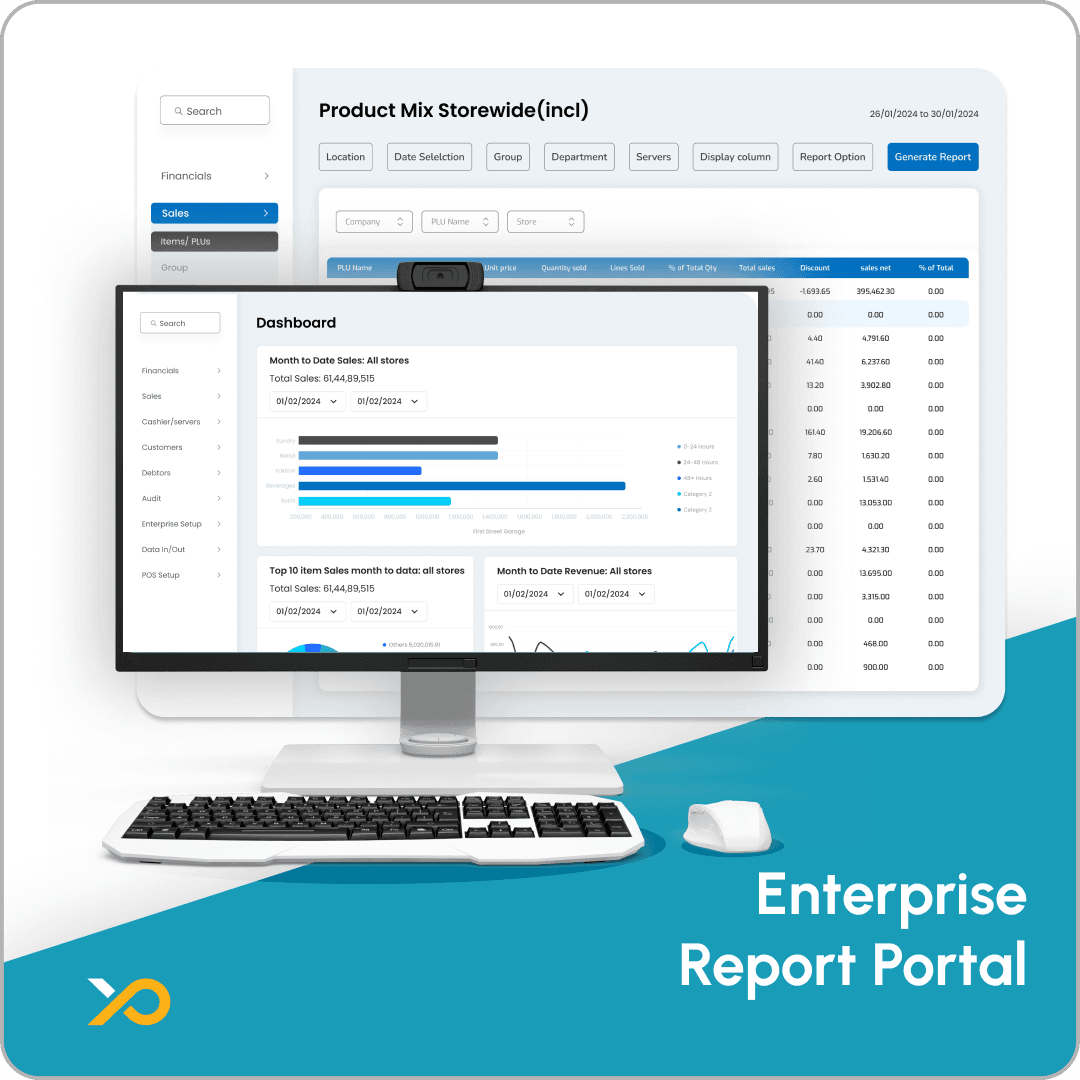
Custom Dashboard

Predictive Analysis

Data Storytelling

Business Intelligence Reports
Data Visualization Tools

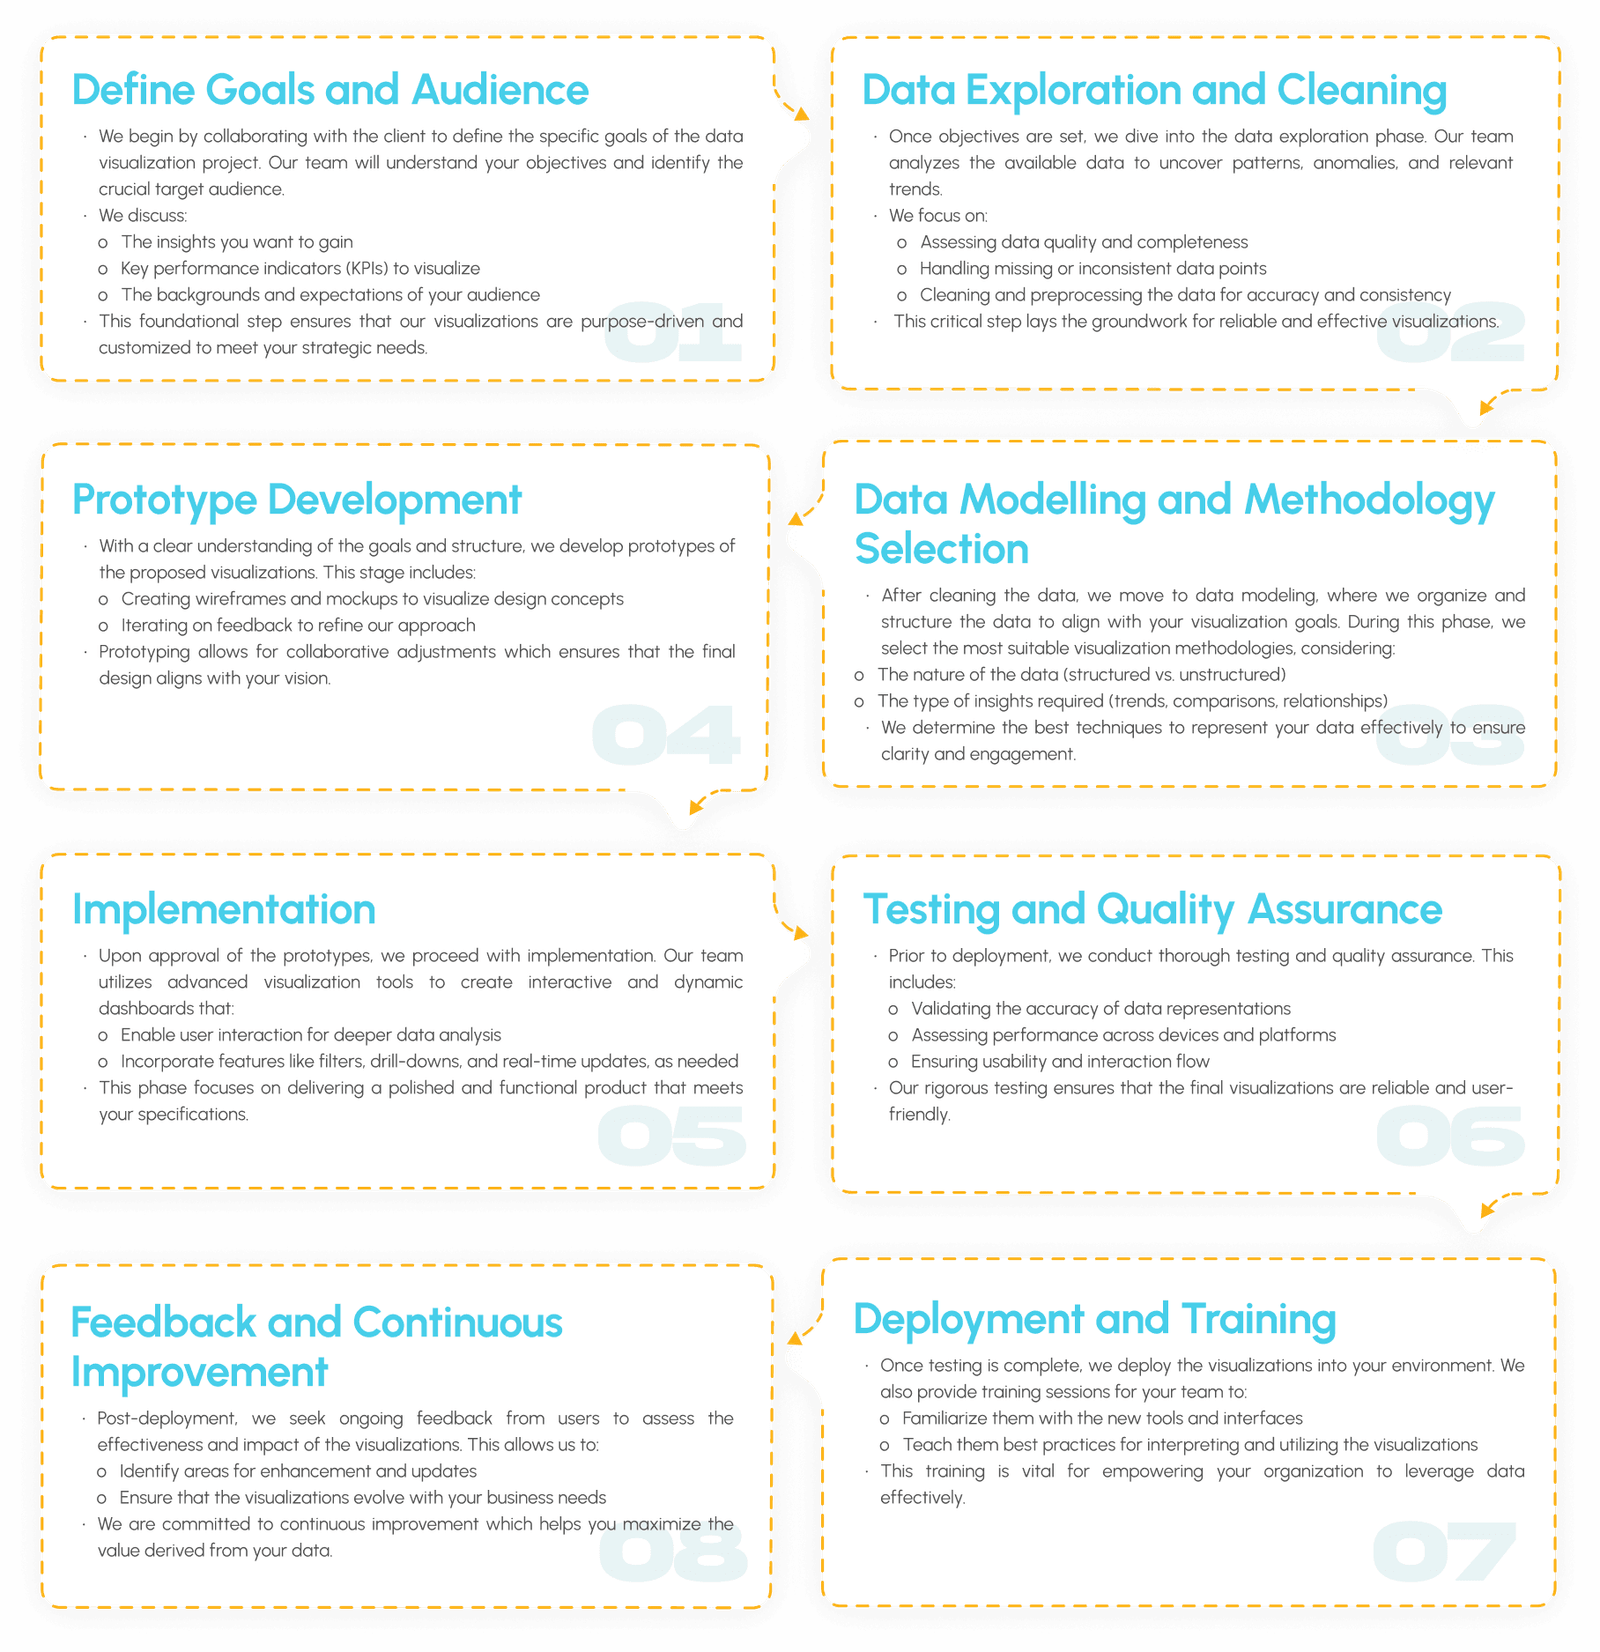
Process We Follow
We believe that a structured approach is essential for a successful data migration project. Here’s an overview of our proven methodology:
Why Choose Polyxer

Expertise in Data Visualization

User-Centric Design

Comprehensive Toolset

Focus on Performance

Customer-Centric Approach

Rich Experience Across Industries

Proven Methodologies


